Features
1. Model Weights, Biases and Gradients Tracking and plotting on histogram.
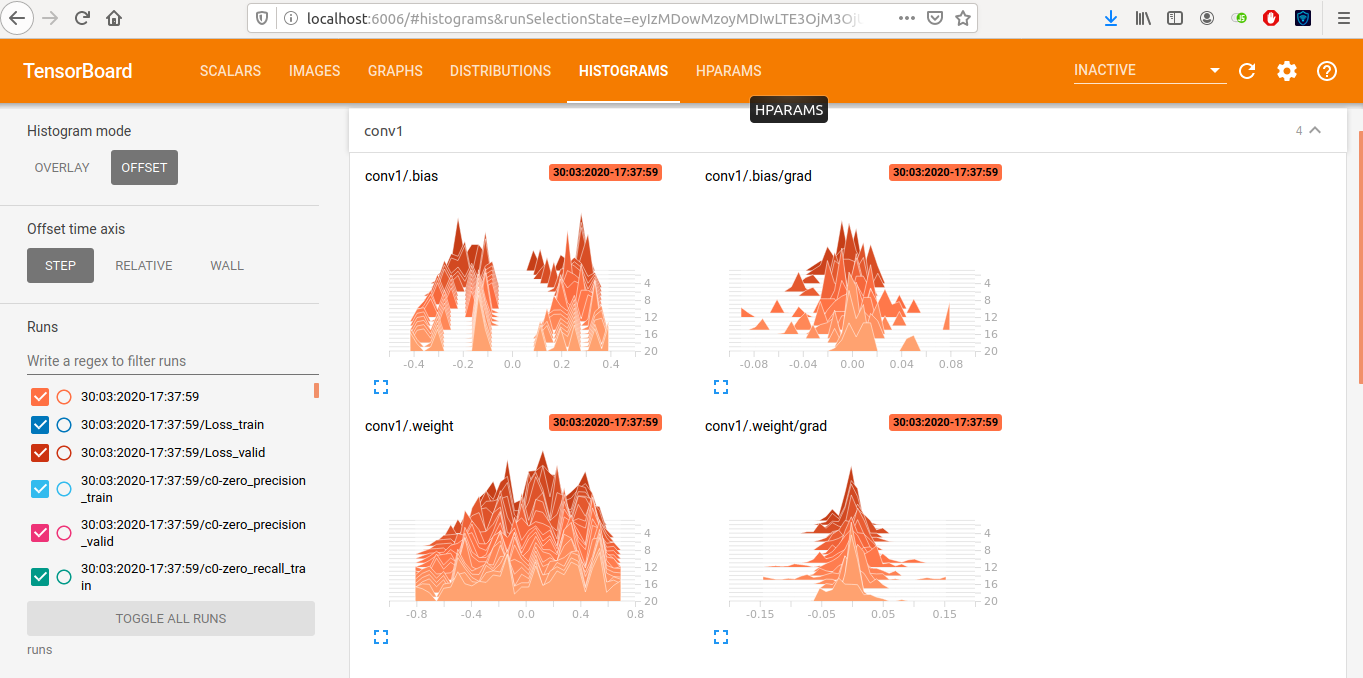
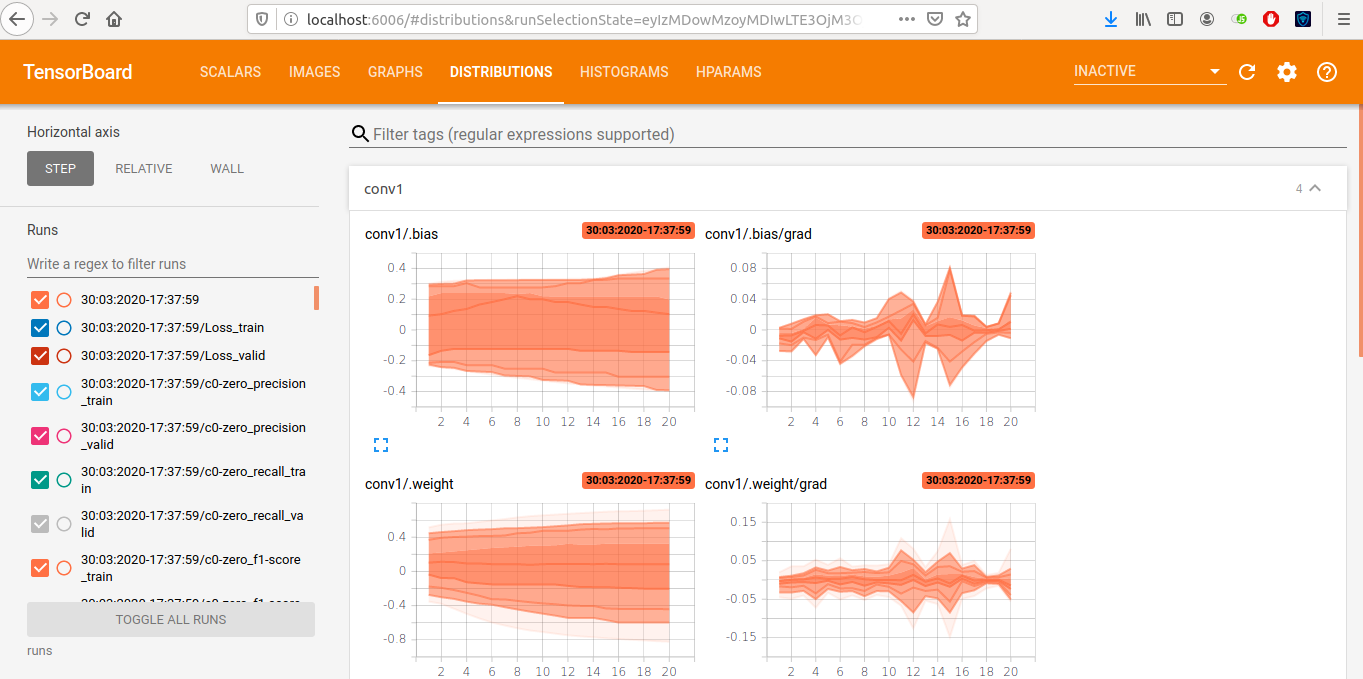
2. Visualizing the distribution of above described Model parameters.
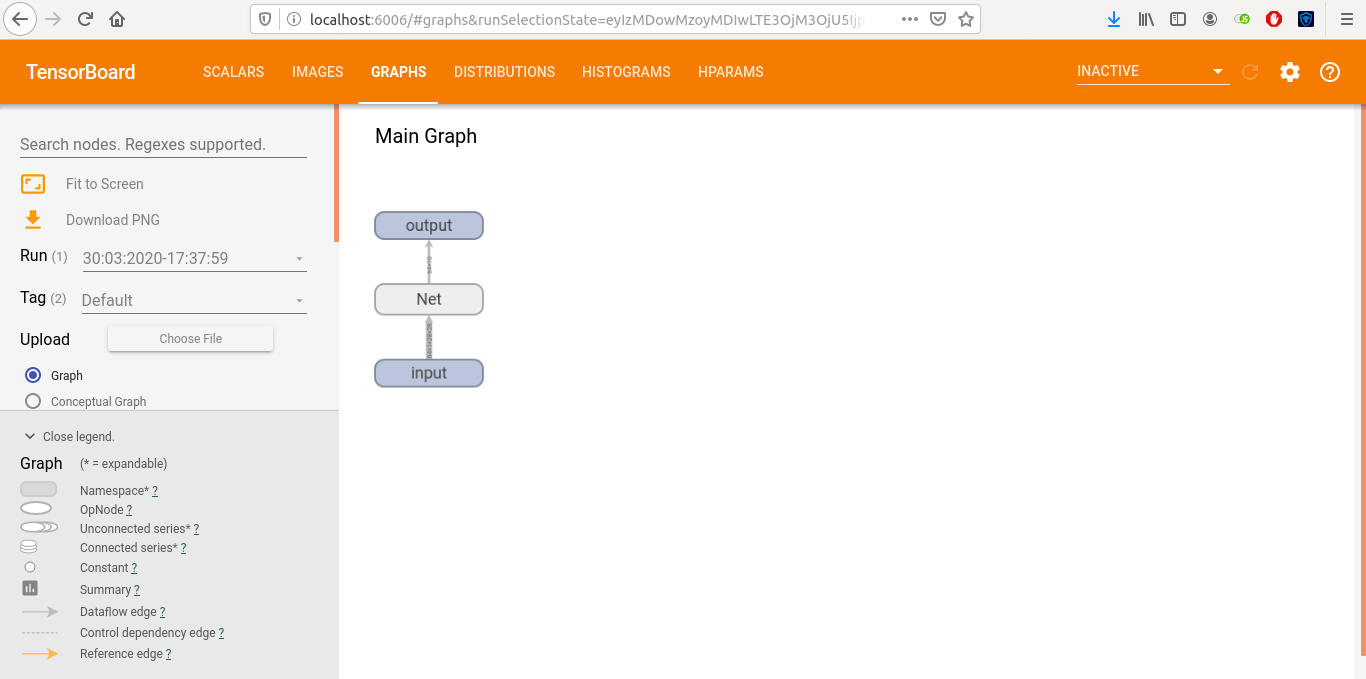
3. Generating an interactive graph of the entire Model
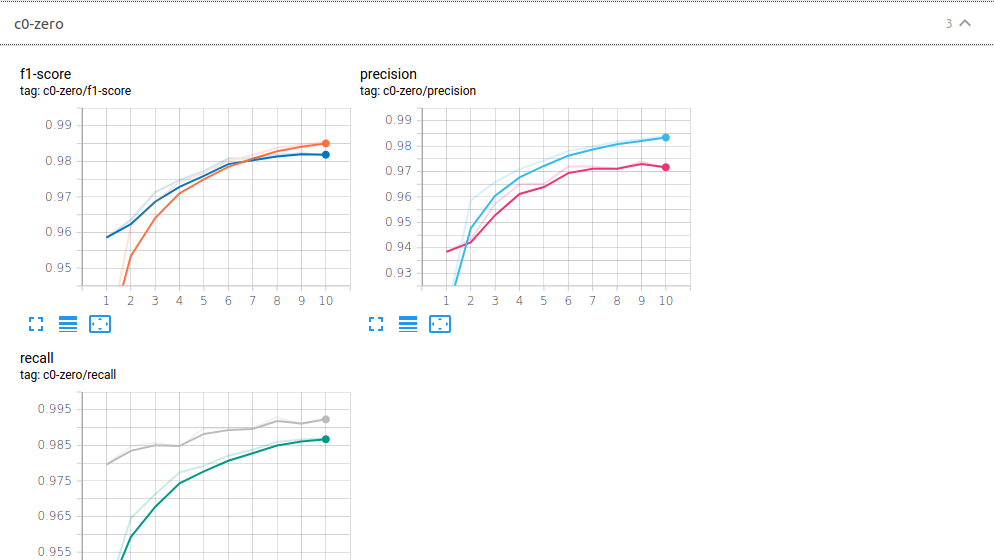
4. Graph of Precision, Recall and F1 Score for all the classes for each epoch.
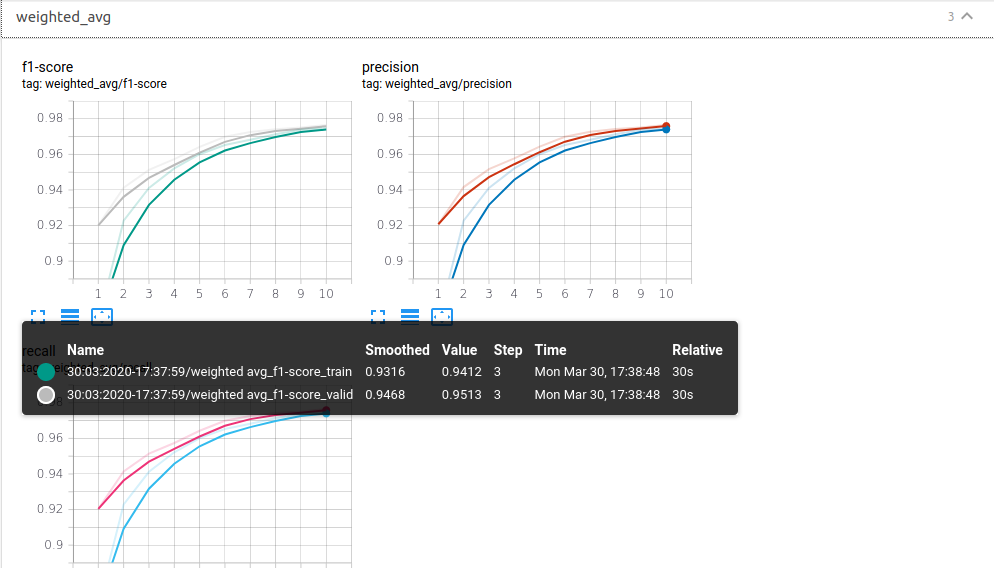
5. Graph of Macro Avg and Weighted Avg of Precision, Recall and F1-score for each epoch.
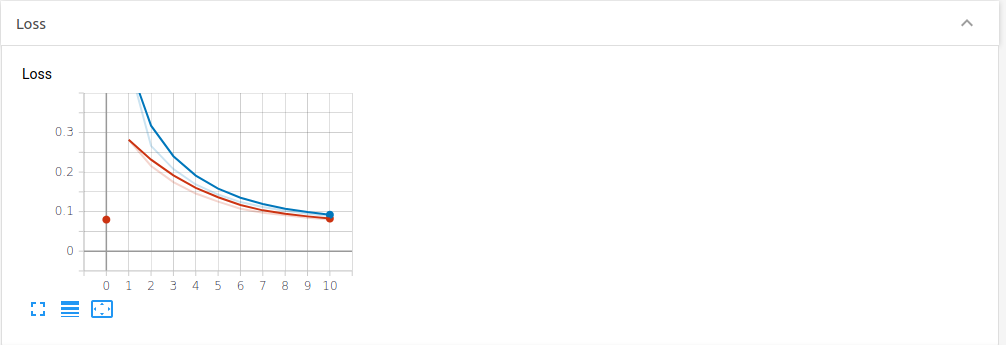
6. Training and Validation Loss tracking for each epoch.
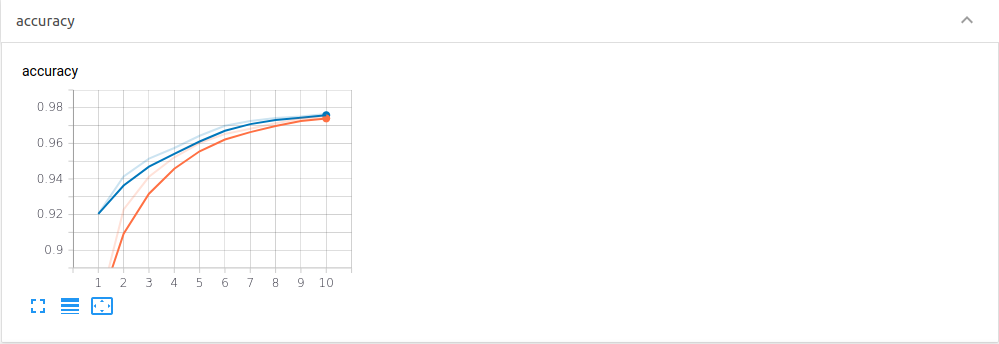
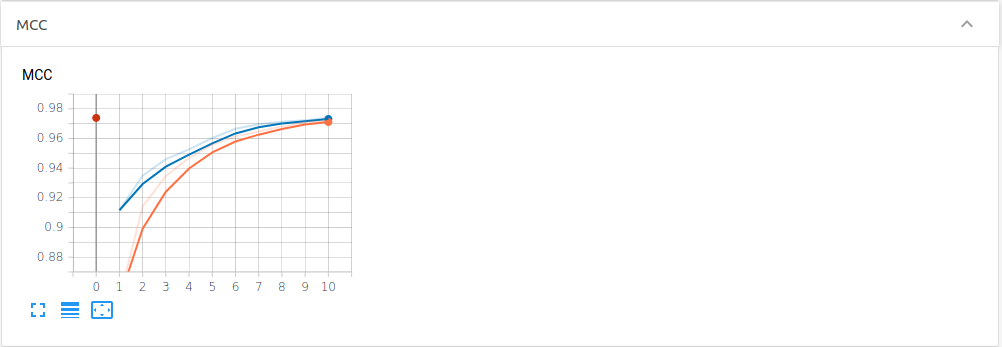
7. Accuracy and MCC metric tracking at each epoch.
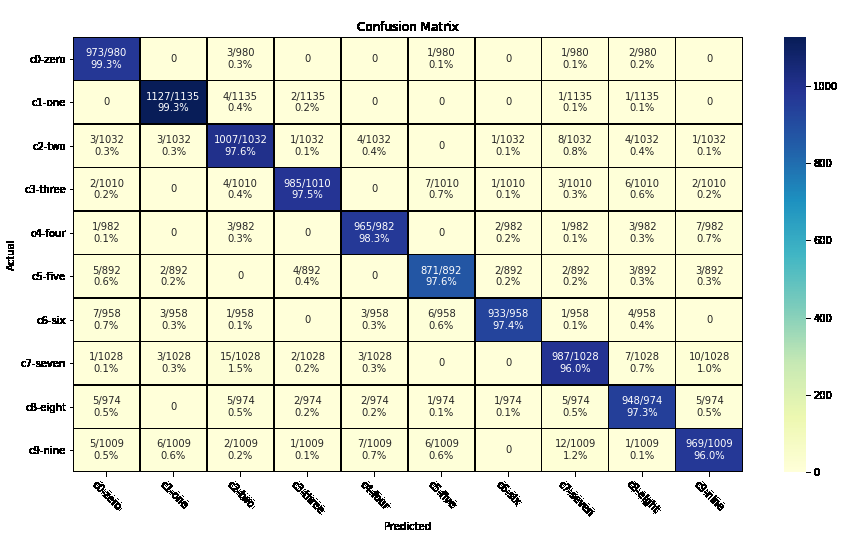
8. Generating Confusion Matrix after certain number of epochs.
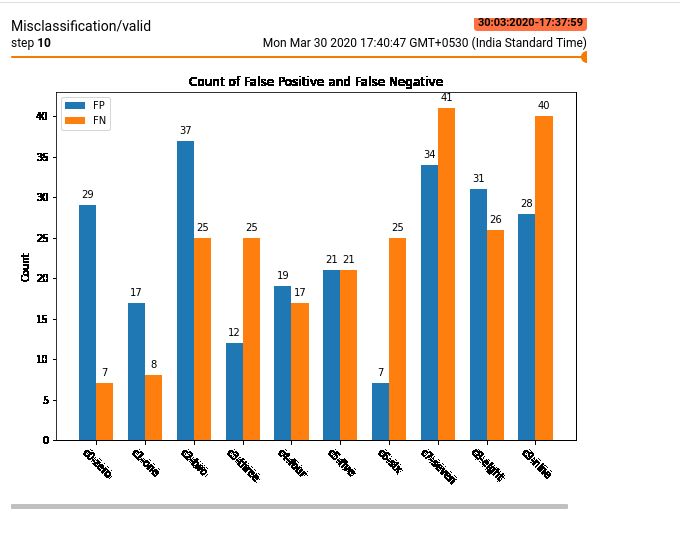
9. Bar Graph for False Positive and False Negative count for each class.
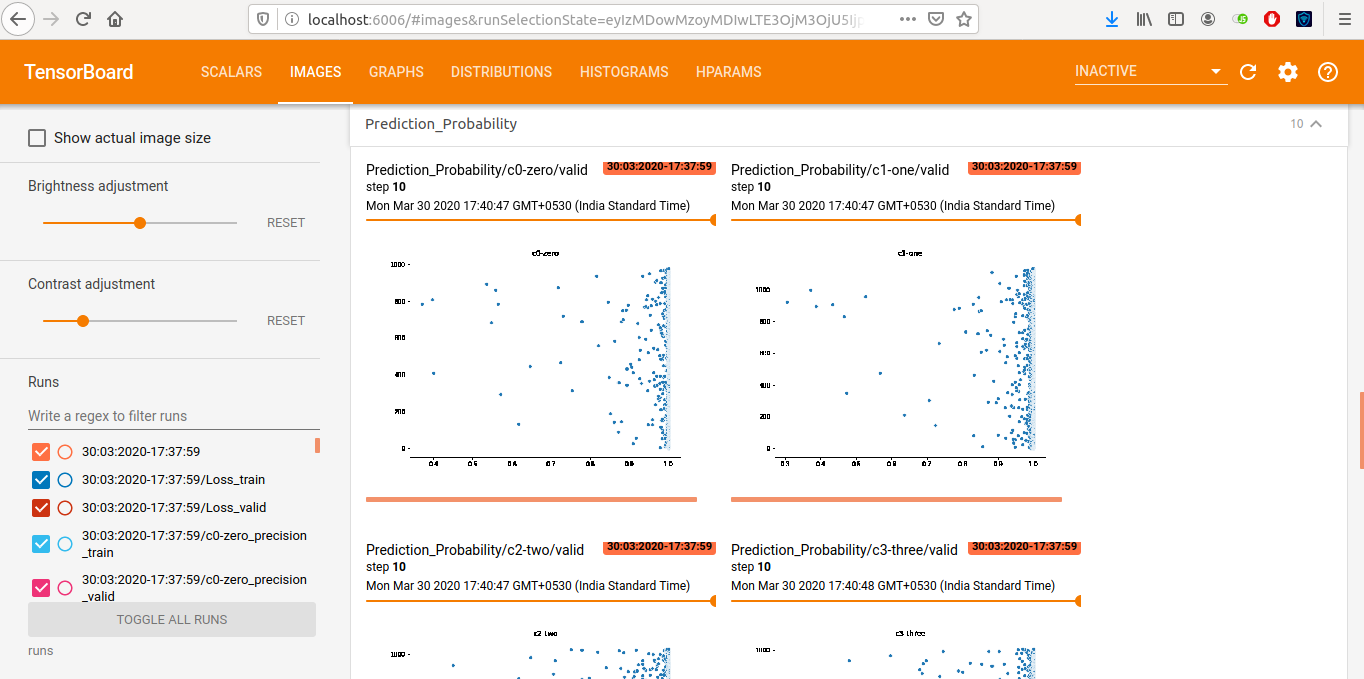
10. Scatter Plot for the predicited probabilities.
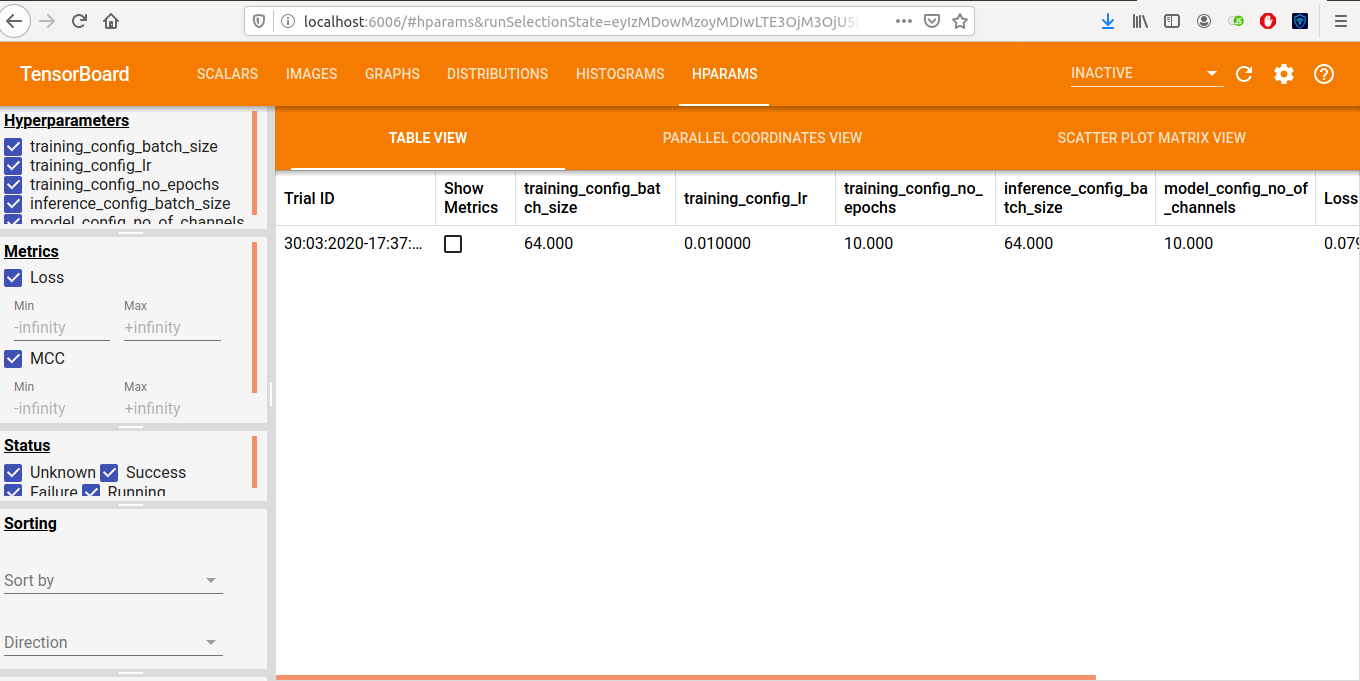
11. Hyparameter Tracking for comparing experiments.